
Where the Market Stands: This Week’s Key Indicators, Movers, and What They Might Mean
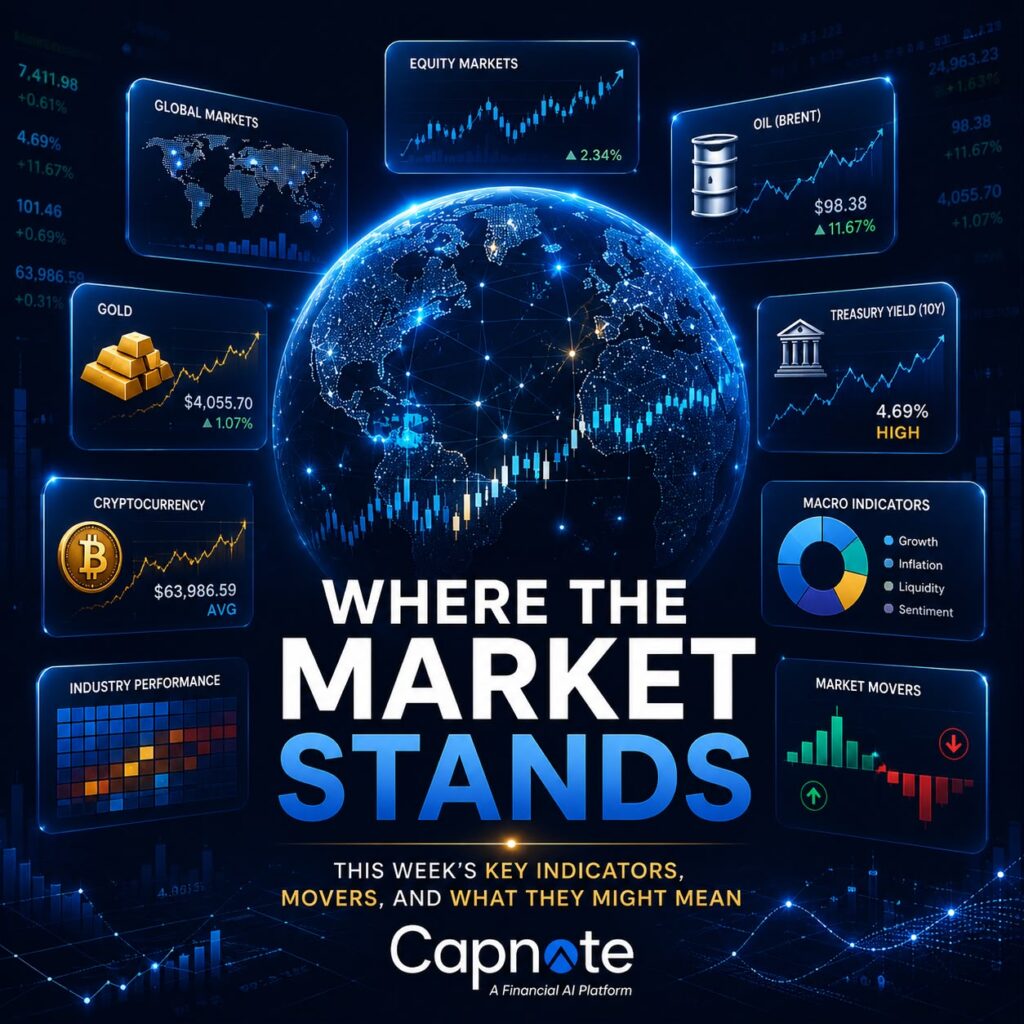
Here’s where the key indicators sit versus their own history, plus the best and worst movers across companies and industries, and the risk and growth factors that may sit behind them. We don’t tell you what to do. We just show you what the data says, then close each section with a quick Read: the possible drivers, and what they could mean.
Stick around to the end for a subscriber offer worth a look.
What the News Is Tagging
These are the most frequent tags produced by our algorithms across top tier U.S. news sources.
1 Week: Petroleum, USA, Geopolitics, UK, Financial Services
Year to Date: Petroleum, USA, Geopolitics, Nigeria, Security & Weapons
Year on Year: USA, Geopolitics, Petroleum, Nigeria, Financial Services
The Read
Petroleum sits at the top of every window, clustered with Geopolitics, Nigeria, and Security & Weapons. That’s a signature of a supply and conflict led news cycle rather than a demand story. Nigeria is a major crude exporter, so its recurring appearance ties the energy and geopolitical threads together. Financial Services surfacing alongside them fits an environment where rates and yields are front of mind.
When the conversation is this energy heavy, inflation and central bank sensitivity tend to follow. It’s the kind of backdrop that historically rewards attention to energy exposure and defensive positioning, though a news tag reflects volume of coverage, not direction of price.
Movers Above $10B Market Cap
Leaders
1 Week
- Super Micro Computer Inc: +26.39%
- Arrowhead Pharmaceuticals Inc: +19.38%
- EQT Corporation: +8.99%
Year to Date
- Virtu Financial, Inc.: +84.32%
- Phillips 66: +60.64%
- Synnex Corporation: +59.68%
Year on Year
- Amkor Technology Inc: +210.06%
- Centene Corp: +136.37%
- FTAI Aviation Ltd.: +98.35%
Capnote tip: common growth factors among top YTD names include positive EBITDA margin, falling leverage, and revenue growth over last year.
Laggards
1 Week
- Workday Inc: -8.54%
- Crowdstrike Holdings Inc: -7.22%
- Dynatrace Holdings LLC: -6.87%
Year to Date
- Intuitive Surgical Inc: -39.41%
- DraftKings Inc: -36.19%
- Zscaler Inc: -34.60%
Year on Year
- Tencent Music Entertainment Group: -56.45%
- Coupang LLC: -49.40%
- Nike Inc: -43.78%
Capnote tip: common risk factors among these YTD laggards include competition and substitutes, shifting customer demand, and technological obsolescence.
The Read
The leaders cluster around three themes: AI and data center hardware (Super Micro, Amkor), energy and refining (EQT, Phillips 66), and volatility fed financials (Virtu). The laggards are almost a mirror image: rate sensitive, high multiple software (Workday, Crowdstrike, Zscaler, Dynatrace), consumer discretionary (Nike, DraftKings), and China exposed names (Tencent Music, Coupang).
This is the classic footprint of a rotation out of long duration growth and into cash flow, energy, and value. When the risk free rate is elevated, richly valued and not yet profitable software tends to get repriced hardest, while producers of real, near term earnings hold up. Worth watching whether the AI hardware strength is a durable capex cycle or a crowded trade.
Movers Below $10B Market Cap
Leaders
1 Week
- Forward Air Corporation: +16.87%
- LB Pharmaceuticals Inc: +14.10%
- Universal Logistics Holdings Inc: +12.39%
Year to Date
- Kelly Services B Inc: +161.01%
- Day One Biopharmaceuticals Inc: +144.84%
- Acadia Healthcare Company Inc: +137.02%
Year on Year
- Climb Bio Inc: +774.08%
- Ironwood Pharmaceuticals Inc: +355.14%
- Mobilicom Limited Warrants: +303.57%
Capnote tip: common growth factors among top YTD names include a diversified business, revenue growth over last year, and positive EBITDA margin.
Laggards
1 Week
- Rapid7 Inc: -18.77%
- PepGen Ltd: -15.97%
- Badger Meter Inc: -15.26%
Year to Date
- Verra Mobility Corp: -82.95%
- Newegg Commerce Inc: -80.00%
- enGene Holdings Inc.: -79.09%
Year on Year
- Verra Mobility Corp: -84.51%
- Anbio Biotechnology (Class A): -82.09%
- LENZ Therapeutics Inc: -82.00%
Capnote tip: common risk factors among these YTD laggards include competition and substitutes, shifting customer demand, and technological obsolescence.
The Read
Small caps show far wider swings. The biotech and clinical stage names (Climb Bio +774%, Ironwood, Day One) are the kind of binary, catalyst driven moves typical of the space, where a single trial or deal can re-rate a stock. Logistics and staffing leaders (Forward Air, Universal Logistics, Kelly Services) hint at freight and labor market activity. On the downside, Verra Mobility’s roughly 83% collapse across both windows stands out as a company specific story rather than a sector one.
Below $10B, dispersion is the headline. Outsized gains and losses sit side by side, so index level moves hide a lot. These extremes reward name by name diligence over broad brush conclusions, and triple digit YoY moves cut both ways.
Industry Performance
Based on weighted average market cap of listed companies, using Capnote’s proprietary groupings.
Highest Performing
1 Week
- Recycling: +7.59%
- Digital & Cryptocurrency: +7.44%
- Intermediaries: +6.83%
Year to Date
- Operator: +149.70%
- Glass: +66.26%
- Data Management: +56.37%
Year on Year
- Operator: +178.09%
- Glass: +156.76%
- Refining & Smelting: +85.62%
Lowest Performing
1 Week
- Children: -5.93%
- Accounting: -4.20%
- Holding Company: -4.07%
Year to Date
- Government Contractor: -37.53%
- Recycling: -34.63%
- Intermediaries: -34.00%
Year on Year
- Digital & Cryptocurrency: -52.04%
- Consulting: -42.99%
- Children: -41.62%
The Read
The industrial and energy chain keeps showing up on the leaderboard. Refining & Smelting and Glass echo the same commodity strength seen in this week’s oil move, while Data Management fits the ongoing appetite for anything tied to data and AI infrastructure. Note the whipsaws: Recycling and Intermediaries appear as both leaders and laggards depending on the window, and Digital & Cryptocurrency is the week’s best short term performer but its worst year over year.
Real economy, commodity linked groups are carrying the trend, while crypto’s split personality is a reminder of how quickly sentiment there reverses. Because these are weighted by market cap, a single mega cap can dominate a category. Treat the labels as a starting point for a closer look, not a verdict.
Where the Big Levels Sit
Positions are shown versus a 5 year moving average. Level reflects standard deviations from the mean.
| Indicator | 1W % | Last | Level |
|---|---|---|---|
| US 10Y Treasury | +3.01 | 4.69 | High |
| S&P 500 | -0.61 | 7,411.98 | Very High |
| Hang Seng | +1.63 | 24,963.23 | High |
| Crude Oil (Brent) | +11.67 | 98.38 | High |
| US Dollar Index (DXY) | +0.69 | 101.46 | Average |
| Gold | +1.07 | 4,055.70 | High |
| Bitcoin | +0.31 | 63,986.59 | Average |
The Read
An unusual trio is stretched at once: the 10Y yield sits high (4.69% versus a 3.46% five year average, roughly 1.15 standard deviations), the S&P is very high (roughly 2.34 standard deviations above trend), and gold is elevated too (roughly 1.86 standard deviations, near $4,056). Normally rich equities and rich gold don’t run together. The combination points to strong risk-on momentum layered over real inflation and uncertainty hedging, with oil’s jump reinforcing the price pressure story. The dollar and Bitcoin, by contrast, are simply average.
When almost everything reads expensive versus its own history, the margin of safety thins and moves can be sharp in either direction. A high risk free rate also raises the bar risky assets must clear to justify their valuations. As always, elevated does not mean overvalued. It’s a prompt to dig into supply, demand, and positioning, not a call.
Biggest Indicator Swings
Gains Since Last Week
- Crude Oil (Brent) · High: +11.67%
- Turkey 10Y · Very High: +10.73%
- Crude Oil (WTI) · High: +10.53%
- Milk · Low: +9.28%
- Switzerland 10Y · Average: +8.88%
Losses Since Last Week
- Coffee · High: -4.34%
- Cocoa · Average: -3.65%
- Gasoline · High: -3.54%
- Russia 10Y · Very High: -2.94%
- Nigeria 10Y · High: -2.87%
The Read
Energy is the story of the week. Brent and WTI both jumped double digits, tying straight back to the petroleum and geopolitics news tags at the top of this post. Rising sovereign yields in Turkey and Switzerland point to shifting rate and currency dynamics abroad. The pullbacks in soft commodities like coffee and cocoa, along with gasoline, look more like normal give back after prior runs.
A crude spike of this size can feed through to fuel, freight, and headline inflation with a lag, which is one to keep an eye on for the broader cost picture. Interestingly, gasoline dipped even as crude surged, a gap that usually closes one way or the other before long.